Procurement Spend & Supplier Performance Dashboard (Power BI)
📌 Overview
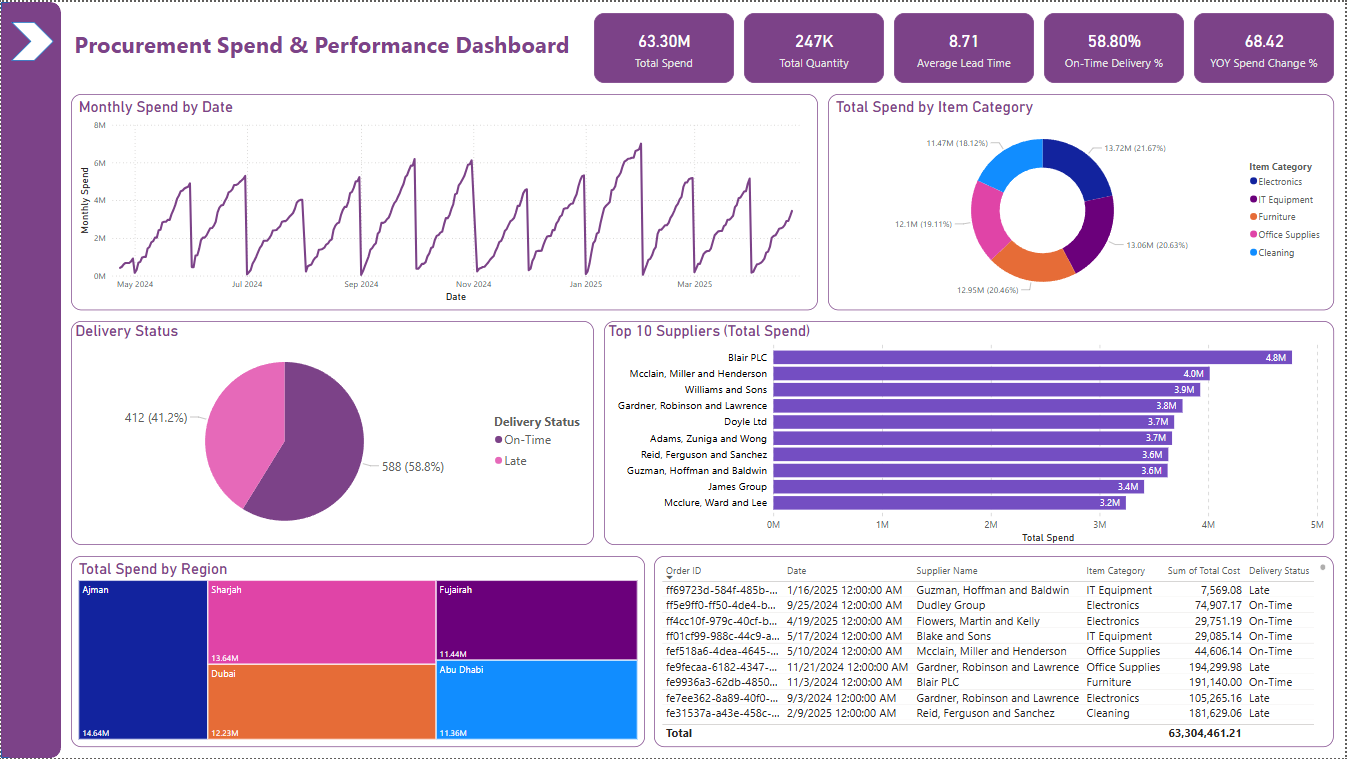
This project presents a fully interactive Power BI dashboard focused on procurement spend analysis and supplier performance monitoring. Built using synthetic but realistic procurement data, the dashboard empowers procurement and finance teams to monitor KPIs, track supplier efficiency, and identify cost optimization opportunities.
🎯 Objectives
- Visualize total spend, average unit price, lead times, and on-time delivery metrics.
- Compare supplier performance across cost, quantity, and fulfillment speed.
- Analyze procurement patterns over time and across regions.
- Enable filtering and dynamic drill-down via slicers.
🧰 Tools Used
- Power BI (Data Modeling, DAX Measures, Visuals)
- DAX (KPIs, Time Intelligence, Conditional Measures)
- Python (pandas, Faker) – For synthetic data generation
- CSV – Clean tabular input to Power BI
📊 Key Features & Metrics
- Total Procurement Spend (DAX)
- Total Quantity Ordered
- Average Lead Time (in Days)
- On-Time Delivery Rate (%)
- Monthly Spend Trends with Year-over-Year % change
- Top 10 Suppliers by Spend
- Spend by Item Category
- Delivery Status Breakdown
- Interactive Filters: Supplier Name, Category, Region, Delivery Status, Date
📐 Dashboard Layout (Visual Hierarchy)
- Top KPIs – Total Spend, Orders, Lead Time, Delivery %
- Middle Section –
- Left: Monthly Trends, Top Suppliers
- Right: Spend by Category, Delivery Status
- Bottom Section –
- Spend by Region Map / Summary Table
- Filter Pane -
- A Filter pane with Hide/Show feature
🗃️ Dataset
A synthetic procurement dataset containing:
OrderID,Supplier,Category,Region,OrderDate,DeliveryDate,Quantity,UnitPrice,TotalCost,DeliveryStatus,LeadTimeDays
📈 Impact
This dashboard format can be directly adopted by procurement teams in mid-to-large enterprises to:
- Optimize supplier selection
- Monitor contract compliance
- Detect outlier costs and inefficiencies
- Improve supply chain planning