Finance Insights Dashboard (SQL + Power BI)
A complete end-to-end financial analytics project simulating a Business Analyst role. This project demonstrates data engineering, SQL analysis, and business intelligence reporting using Power BI.
🧾 Project Summary
This project analyzes simulated financial data across multiple revenue streams to evaluate monthly performance, identify budget variances, and calculate profitability. It aligns closely with the responsibilities of a Business Analyst in a finance-focused role.
📁 Tech Stack
- SQLite – Local database to simulate real-world ETL pipelines
- SQL – Data transformation, variance calculations, and financial KPIs
- Python (Faker, Pandas) – Synthetic dataset generation
- Power BI – Dashboard creation, KPI tracking, interactive visualizations
📊 Key Features
- Revenue vs Budget Analysis (absolute and % variance)
- Gross Profit and Gross Margin tracking by month and product line
- Power BI dashboard with slicers, cards, charts, and tables
- SQL-driven ETL pipeline from SQLite database
📌 Dataset
Simulated data with the following fields:
Month(2024)Product(Property Listings, Premium Ads, Memberships)Budget_Revenue,Actual_Revenue,Cost- Calculated metrics:
Variance,Variance %,Gross Profit,Gross Margin %
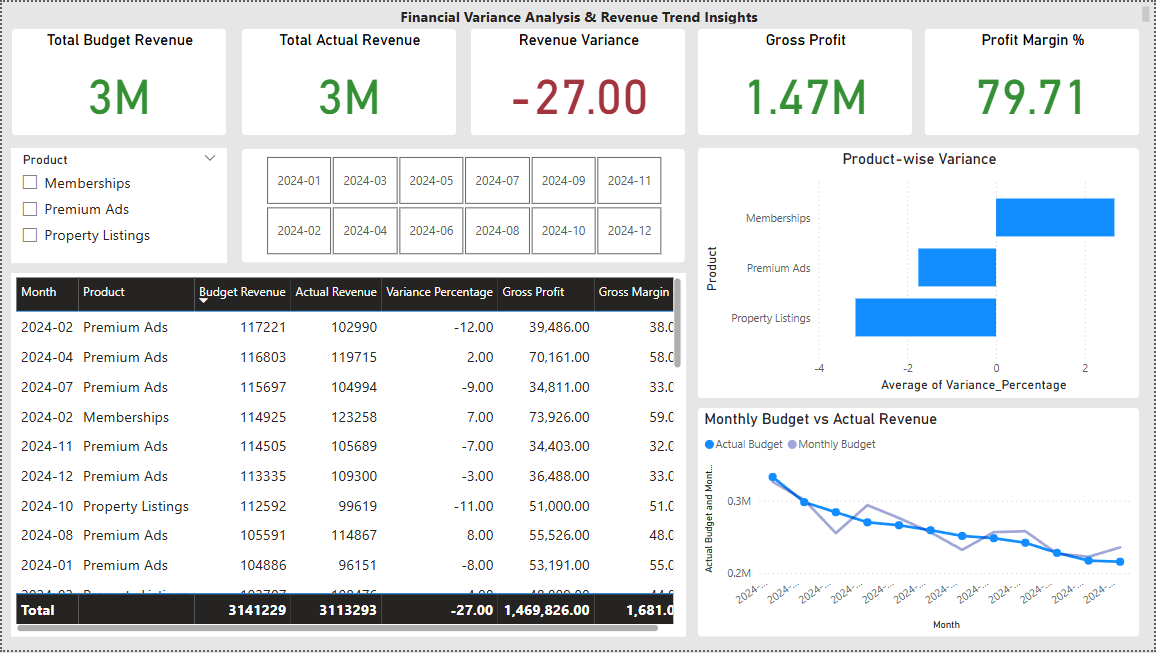
📈 Power BI Dashboard Highlights
- Line Chart: Monthly Budget vs Actual Revenue
- Bar Chart: Product-wise Variance %
- KPI Cards: Total Revenue, Variance, Gross Profit, Margins
- Slicers: Filter by Month or Product
- Insights Panel: Executive-level summaries