📊 E-Commerce Power BI Analytics Dashboard: A Comprehensive Business Intelligence Solution
Introduction
In today's data-driven world, the ability to extract actionable insights from complex datasets is a critical skill for any business analyst or BI developer. This project represents my journey toward mastering enterprise-level analytics using Microsoft Power BI, one of the most powerful tools in the modern BI landscape.
The goal was simple yet ambitious: build a comprehensive E-Commerce Analytics Dashboard that integrates multiple data sources, implements advanced modeling and DAX logic, delivers interactive dashboards, and enforces robust security through Row-Level Security (RLS). Along the way, I aimed to refine key skills in:
- Connecting to multiple data sources
- Building efficient data models
- Writing performant DAX measures
- Designing insightful dashboards
- Implementing enterprise-grade security (RLS)
This article dives deep into each phase of the project, explaining not just what was built, but why certain decisions were made and how they align with best practices in the industry.
🔧 Project Setup & Data Integration
Prerequisites
Before diving into visualization and analysis, I set up a clean development environment with the following tools:
- Power BI Desktop: Latest version for design and development
- Python 3.7+: For generating synthetic e-commerce data
- SQL Server Express (optional): For practicing enterprise database integration
- Required Python libraries:
pandas,numpy,openpyxl
Data Generation Script
To simulate a real-world scenario, I created a Python script that generated six CSV files:
customers.csv: Customer demographics and registration infoproducts.csv: Product catalog with pricing and lifecycle detailssales.csv: Transactional sales recordscustomer_feedback.csv: Ratings and feedback per product/customeremployees.csv: Employee data for RLS implementationsuppliers.csv: Supplier relationships for products
Additionally, an Excel file (business_data.xlsx) contained two sheets:
SalesTargets: Monthly targets by regionCategoryDetails: Product category metadata
I also connected to external APIs such as the Exchange Rates API to demonstrate live web integration.
✅ Why this matters: Working with multiple data types (CSV, Excel, SQL, API) mimics real enterprise environments where data lives across systems.
🗂 Data Modeling & Star Schema Design
Building the Star Schema
The foundation of any solid BI solution is its data model. I designed a star schema consisting of:
- Fact Table:
Sales– containing transactional data like order date, quantity, total amount - Dimension Tables:
CustomersProductsDate(a calculated calendar table)EmployeesSuppliersCustomerFeedback
Each dimension table connects to the fact table via foreign keys, enabling fast and scalable reporting.
Creating the Date Table
A high-quality date table is essential for time intelligence calculations. I used DAX to generate a full 3-year calendar with rich attributes:
Date =
VAR MinDate = DATE(2022, 1, 1)
VAR MaxDate = DATE(2024, 12, 31)
RETURN
ADDCOLUMNS(
    CALENDAR(MinDate, MaxDate),
    "Year", YEAR([Date]),
    "Month", MONTH([Date]),
    "MonthName", FORMAT([Date], "MMMM"),
    "Quarter", QUARTER([Date]),
    "QuarterName", "Q " & QUARTER([Date]),
    "WeekDay", WEEKDAY([Date]),
    "WeekDayName", FORMAT([Date], "dddd"),
    "MonthYear", FORMAT([Date], "MMM YYYY"),
    "IsWeekend", IF(WEEKDAY([Date]) IN {1,7}, TRUE, FALSE),
    "YearMonth", YEAR([Date]) * 100 + MONTH([Date])
)
This allowed me to implement dynamic year-to-date (YTD), month-to-date (MTD), quarter-over-quarter (QoQ), and year-over-year (YoY) metrics.
🧮 Advanced DAX Calculations
DAX is the heart of Power BI, and I invested significant time crafting meaningful, reusable measures. Here are some of the core calculations I implemented:
Sales Performance Metrics
Total Sales = SUM(Sales[TotalAmount])

Total Profit = [Total Sales] - SUMX(Sales, Sales[Quantity] * RELATED(Products[CostPrice]))

Profit Margin % = DIVIDE([Total Profit], [Total Sales], 0) * 100
These basic but vital measures provided the foundation for all financial reporting.
Time Intelligence
Sales YTD = TOTALYTD([Total Sales], Date[Date])

Sales YoY =
VAR CurrentYearSales = [Total Sales]
VAR PreviousYearSales = CALCULATE([Total Sales], DATEADD(Date[Date], -1, YEAR))
RETURN DIVIDE(CurrentYearSales - PreviousYearSales, PreviousYearSales, 0) * 100
These enabled strategic comparisons across periods and helped identify trends over time.
Customer Lifetime Value (LTV)
Customer LTV = DIVIDE([Total Sales], DISTINCTCOUNT(Sales[CustomerID]), 0)
This metric became crucial for customer segmentation and marketing planning.
Product ABC Analysis
Product ABC Category =
VAR ProductRevenue = [Total Sales]
VAR TotalRevenue = CALCULATE([Total Sales], ALL(Products))
VAR RevenuePercentage = DIVIDE(ProductRevenue, TotalRevenue, 0)
RETURN SWITCH(TRUE(), RevenuePercentage >= 0.8, "A", RevenuePercentage >= 0.15, "B", "C")
Used for inventory prioritization and resource allocation.
💡 Insight: The use of variables in DAX significantly improved performance and readability, especially in complex measures like forecasting and cohort analysis.
📈 Dashboard Development
I built four distinct dashboards tailored to different user roles and analytical needs:
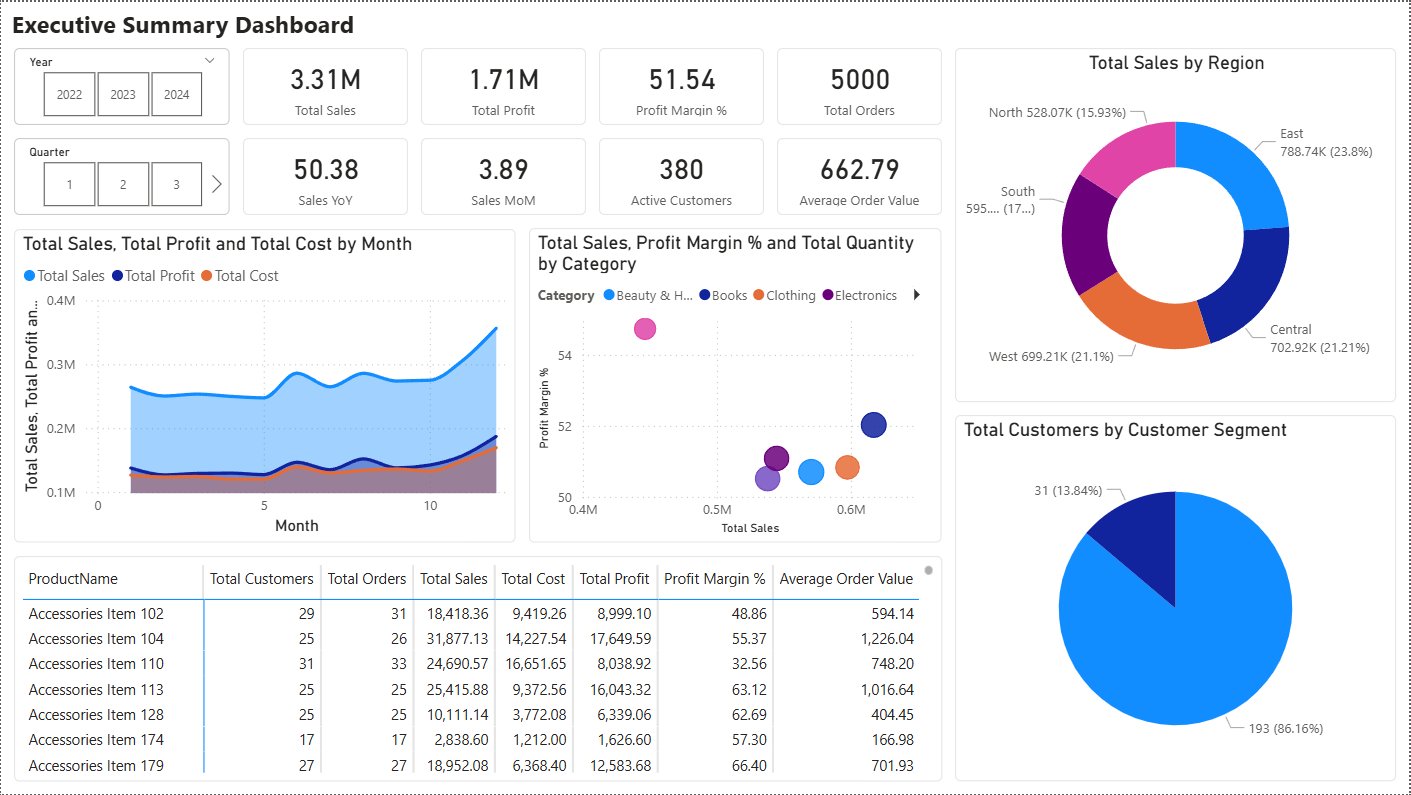
1. Executive Summary Dashboard
Designed for leadership, this dashboard included:
- KPI cards showing Total Sales, Profit, Orders
- Sales trend line chart comparing current vs previous year
- Regional donut chart and top 10 products bar chart
2. Sales Performance Dashboard
For regional managers and analysts:
- Waterfall chart for monthly sales
- Matrix view of sales by category and year
- Global map visualization
- Time-based metrics (YTD, MTD, etc.)
3. Customer Analytics Dashboard
Focused on understanding buyer behavior:
- Treemap of customer lifetime value
- Area chart of new vs repeat customers
- Stacked column chart of demographics
- Cohort analysis for retention tracking
4. Product Analysis Dashboard
Helped product teams evaluate profitability and lifecycle:
- Scatter plot of sales vs profit margin
- ABC classification chart
- Lifecycle stage breakdown
- Inventory turnover gauge
🎨 Design Tip: I integrated custom visuals like radar charts, word clouds, and bullet charts to enhance storytelling and make data more digestible.
🔐 Security Implementation: Row-Level Security (RLS)
Security is a cornerstone of enterprise BI. I implemented Row-Level Security (RLS) to ensure users only see data relevant to their role.
Role Definitions
- Executive: Full access
- Regional Manager: Can view only their assigned region
- Sales Representative: Can view only assigned customers
Dynamic Mapping Table
UserRegionMapping =
DATATABLE(
    "UserEmail", STRING,
    "Region", STRING,
    "Role", STRING,
    {
        {"john.manager@company.com", "North", "Regional Manager"},
        {"sarah.director@company.com", "South", "Regional Manager"},
        {"executive@company.com", "All", "Executive"}
    }
)
RLS Filter Expression
VAR UserEmail = USERPRINCIPALNAME()
VAR UserRegion = LOOKUPVALUE(UserRegionMapping[Region], UserRegionMapping[UserEmail], UserEmail)
VAR UserRole = LOOKUPVALUE(UserRegionMapping[Role], UserRegionMapping[UserEmail], UserEmail)
RETURN IF(UserRole = "Executive", TRUE(), [Region] = UserRegion)
This approach ensured secure, flexible, and maintainable access control.
⚠️ Note: While I completed RLS successfully, object-level security and data masking remain on my roadmap for further enhancement.
🛠 Optimization & Best Practices
Throughout the project, I focused on building a solution that not only works well now but scales efficiently as data grows.
Model Optimization
- Hidden unnecessary columns
- Set appropriate default summarizations
- Created hierarchies for drill-down (e.g., Year → Quarter → Month)
- Used proper formatting and categorization for better UX
Performance Enhancements
- Optimized DAX using variables and avoiding redundant calculations
- Implemented aggregation tables for faster querying
- Leveraged incremental refresh for large datasets
- Limited visual complexity (e.g., capped scatter plot points)
📄 Documentation & Training Materials
A great dashboard is only as useful as the documentation that supports it. I will create the following:
Data Model Documentation: Clear descriptions of tables, fields, and relationshipsDAX Formula Reference: Explained every measure with usage notes and dependenciesBusiness Rules Manual: Defined segmentation logic, lifecycle stages, and alert thresholdsUser Guides: Step-by-step instructions for executives, managers, and repsQuick Reference Cards: One-page guides for daily tasks and troubleshooting
📚
Bonus: I also drafted training video scripts and prepared internal FAQs to support onboarding and adoption.
🔄 Automation Strategy (Future Work)
As part of my long-term vision, I plan to automate several aspects of the solution:
- Scheduled Refreshes: Using Power BI Service with alerts and notifications
- Automated Reporting: Sending PDF reports via email using Power Automate
- Alert Systems: Real-time monitoring of KPIs and anomaly detection
- Mobile Dashboards: Tailored layouts for smartphones and tablets
🧩 Why This Project Matters
This project demonstrates a full end-to-end BI workflow, from raw data ingestion to polished dashboards with enterprise-grade security. It reflects:
- Strong technical proficiency in Power BI
- Understanding of business logic and stakeholder needs
- Attention to detail in data modeling, visualization, and governance
- Commitment to continuous learning and improvement
It serves as a showcase of both my technical abilities and my analytical thinking, making it a standout piece in my portfolio.
📁 GitHub Repository
You can explore the complete project, including the Power BI file, data generation scripts, documentation, and training materials, on my GitHub repository:
📬 Final Thoughts
Building this E-Commerce Power BI Dashboard has been one of the most rewarding projects in my journey as a data analyst. It challenged me technically while keeping me grounded in real-world business applications.
Whether you're a hiring manager looking for a skilled Power BI developer or a fellow learner exploring the field, I hope this project inspires you to dig deeper into the world of analytics — one dashboard at a time.
Thank you for reading!